

How to read the Naplan student report
Understanding the Naplan student report
A student’s result is shown on an achievement scale for each assessment area. Results across the Years 3, 5, 7 and 9 literacy and numeracy assessments are reported on a scale from Band 1 to Band 10. The achievement scale represents increasing levels of knowledge, understanding and skills demonstrated in the assessments. Results for Year 3 are reported across the range of Band 1 to Band 6, with Band 2 representing the national minimum standard for this year level. The national average and the range of achievement for Year 3 students are also shown on the scale. Your child’s results are shown on the inside pages of this report.
Results for both NAPLAN and NAP sample assessments tests are measured in similar ways. There are 2 important elements to how these results are reported: the scale and the performance standard that are used.
NAPLAN Scales
NAPLAN results are measured at a student level against an assessment scale in each of the areas tested. The scales span all the year levels from Year 3 to Year 9, and are divided into 10 bands. Not all bands are reported for each year level.
NAP sample assessment results are measured against a proficiency scale for each domain. The proficiency scales are grouped into a number of different levels.
More information about the scales used for NAPLAN and NAP sample assessments can be found at Scales.
NAPLAN Standards
For NAPLAN results, a national minimum standard is defined and located on the assessment scale for each year level. Band 2 is the minimum standard for Year 3, band 4 is the minimum standard for Year 5, band 5 is the minimum standard for Year 7 and band 6 is the minimum standard for Year 9. These standards represent increasingly challenging skills and require increasingly higher scores on the NAPLAN scale.
For NAP sample assessments, proficient standards represent a ‘challenging but reasonable’ level of performance where students need to demonstrate more than the minimal skills expected at that year level.
More information about the performance standards defined for NAPLAN and NAP sample assessments can be found at Standards.
NAPLAN
The national minimum standards and common scales for NAPLAN results across all year levels are illustrated in the picture below:
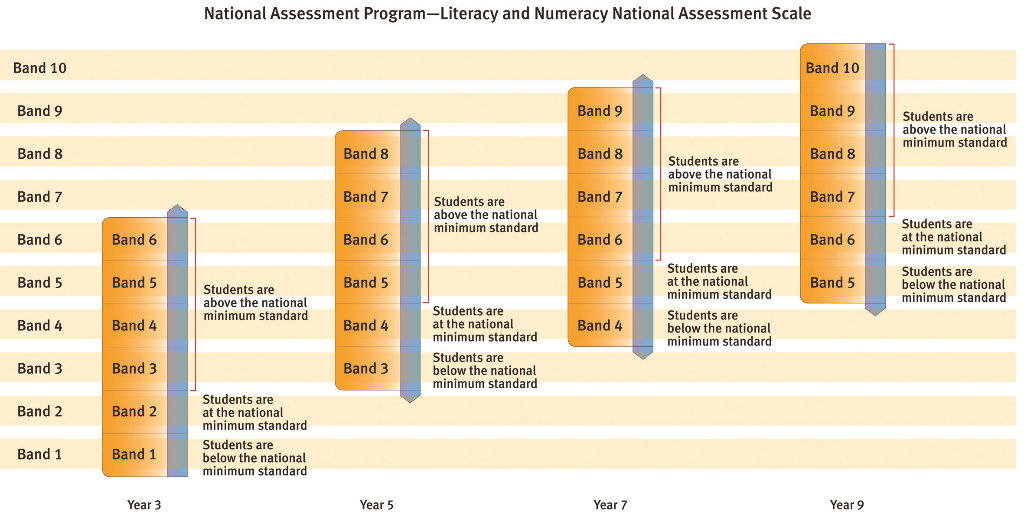
What is the highest NAPLAN score?
The NAPLAN assessment scale is divided into 10 bands to record student results in the tests. Band 1 is the lowest band and band 10 is the highest band.
What is the highest NAPLAN score for Year 3?
Subscribe to our WhatsApp channel to get the latest posts delivered right to your dm.
Comments